Day 30 – Metamapping day
Final day! Spend the day either by
- collecting your entries from the challenge to a common gallery,
- writing a tutorial or a blog post on one of your maps or
- create a map from a theme you have chosen yourself.
As stated in my original tweet on November 2nd, I didn’t plan to participate in this challenge but ended up jumping in (a bit) late, thinking I would do only the fun ones if I have the time.
I hadn’t anticipated it would be fun in that way. Fun to browse through the #30DayMapChallenge hashtag, to find people running similar ideas with different tools or data sources, people introducing new stuff they are passionate about.
I hadn’t imagine it would be so mind challenging to think about what kind of map I should prepare, sometimes few days in advance because of other life constraints.
As I develop a Python mapping library cartes designed to quickly draft fun maps with many projections and a good OpenStreetMap API, I thought this challenge would be a baptism of fire: I ended up fixing many minor bugs on the fly (or writing them down to deal with them later) and thinking new features required for next maps.
Eventually, I found contributions for all topics, one map per day. Some maps are redundant, for sure. I was also not equally inspired by all topics. If I run again in the future, I would probably plan things a bit more (but not too much, improvisation is part of the fun!) and only pick topics where I feel I can bring something meaningful.
Down to the most important: this map challenge is not a competition. We all do it for fun. So today, I would like to reflect on this past month and handpick few of my favourite maps I made this month.
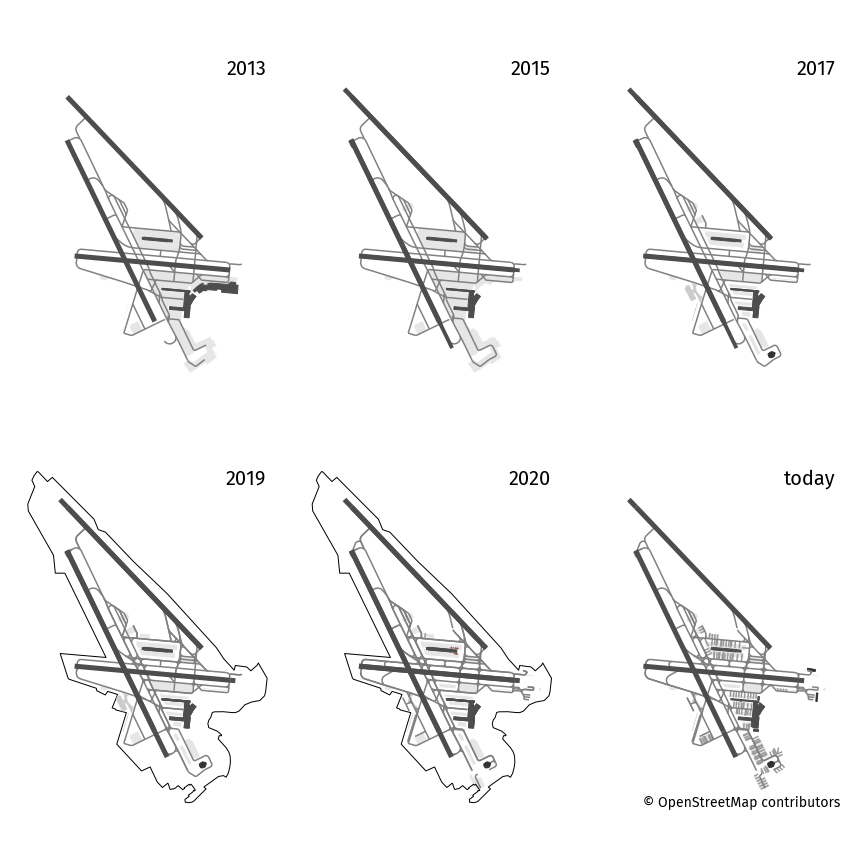
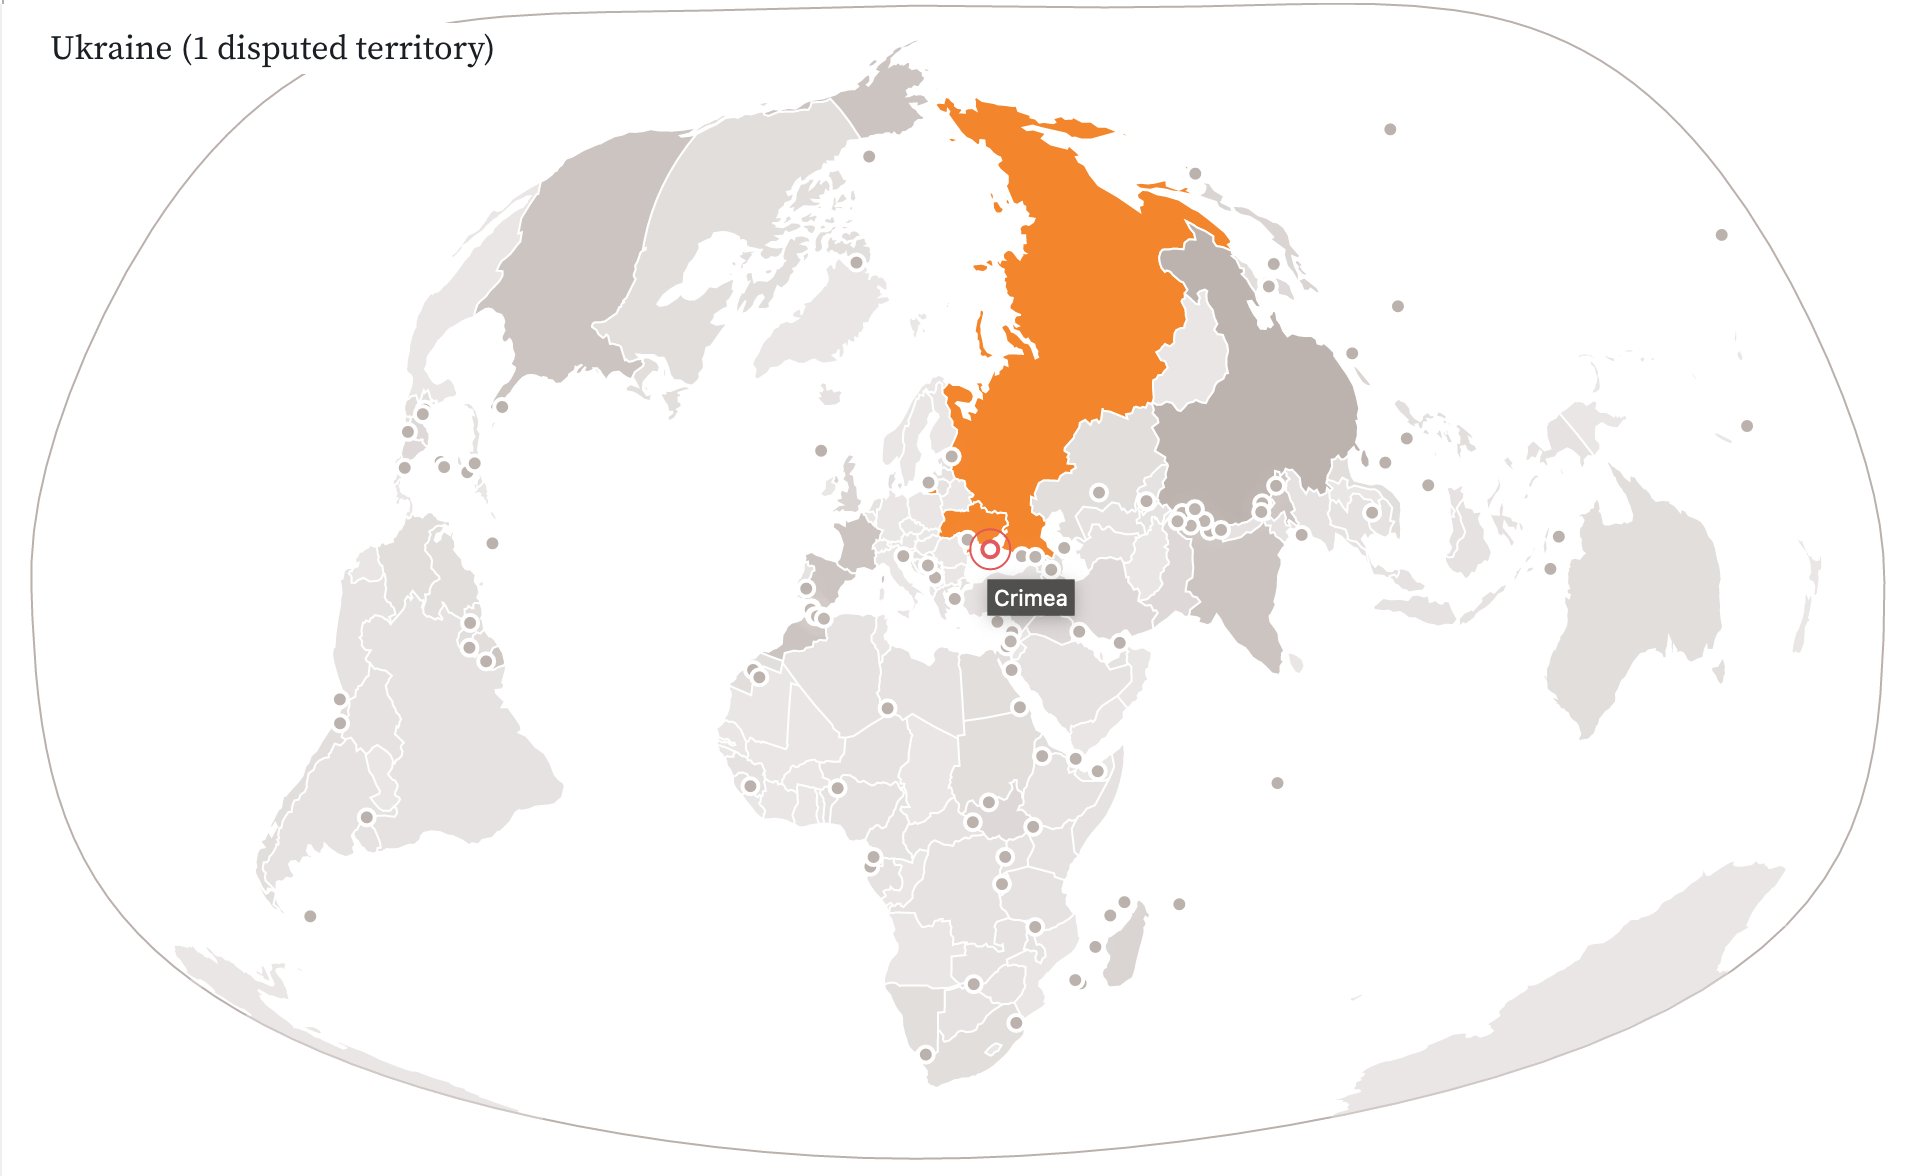
The most popular map on social networks
Day 20 – Movement broke Twitter (compared to my usual impact there). The map has then been shortlisted here based on the popularity of the tweet.
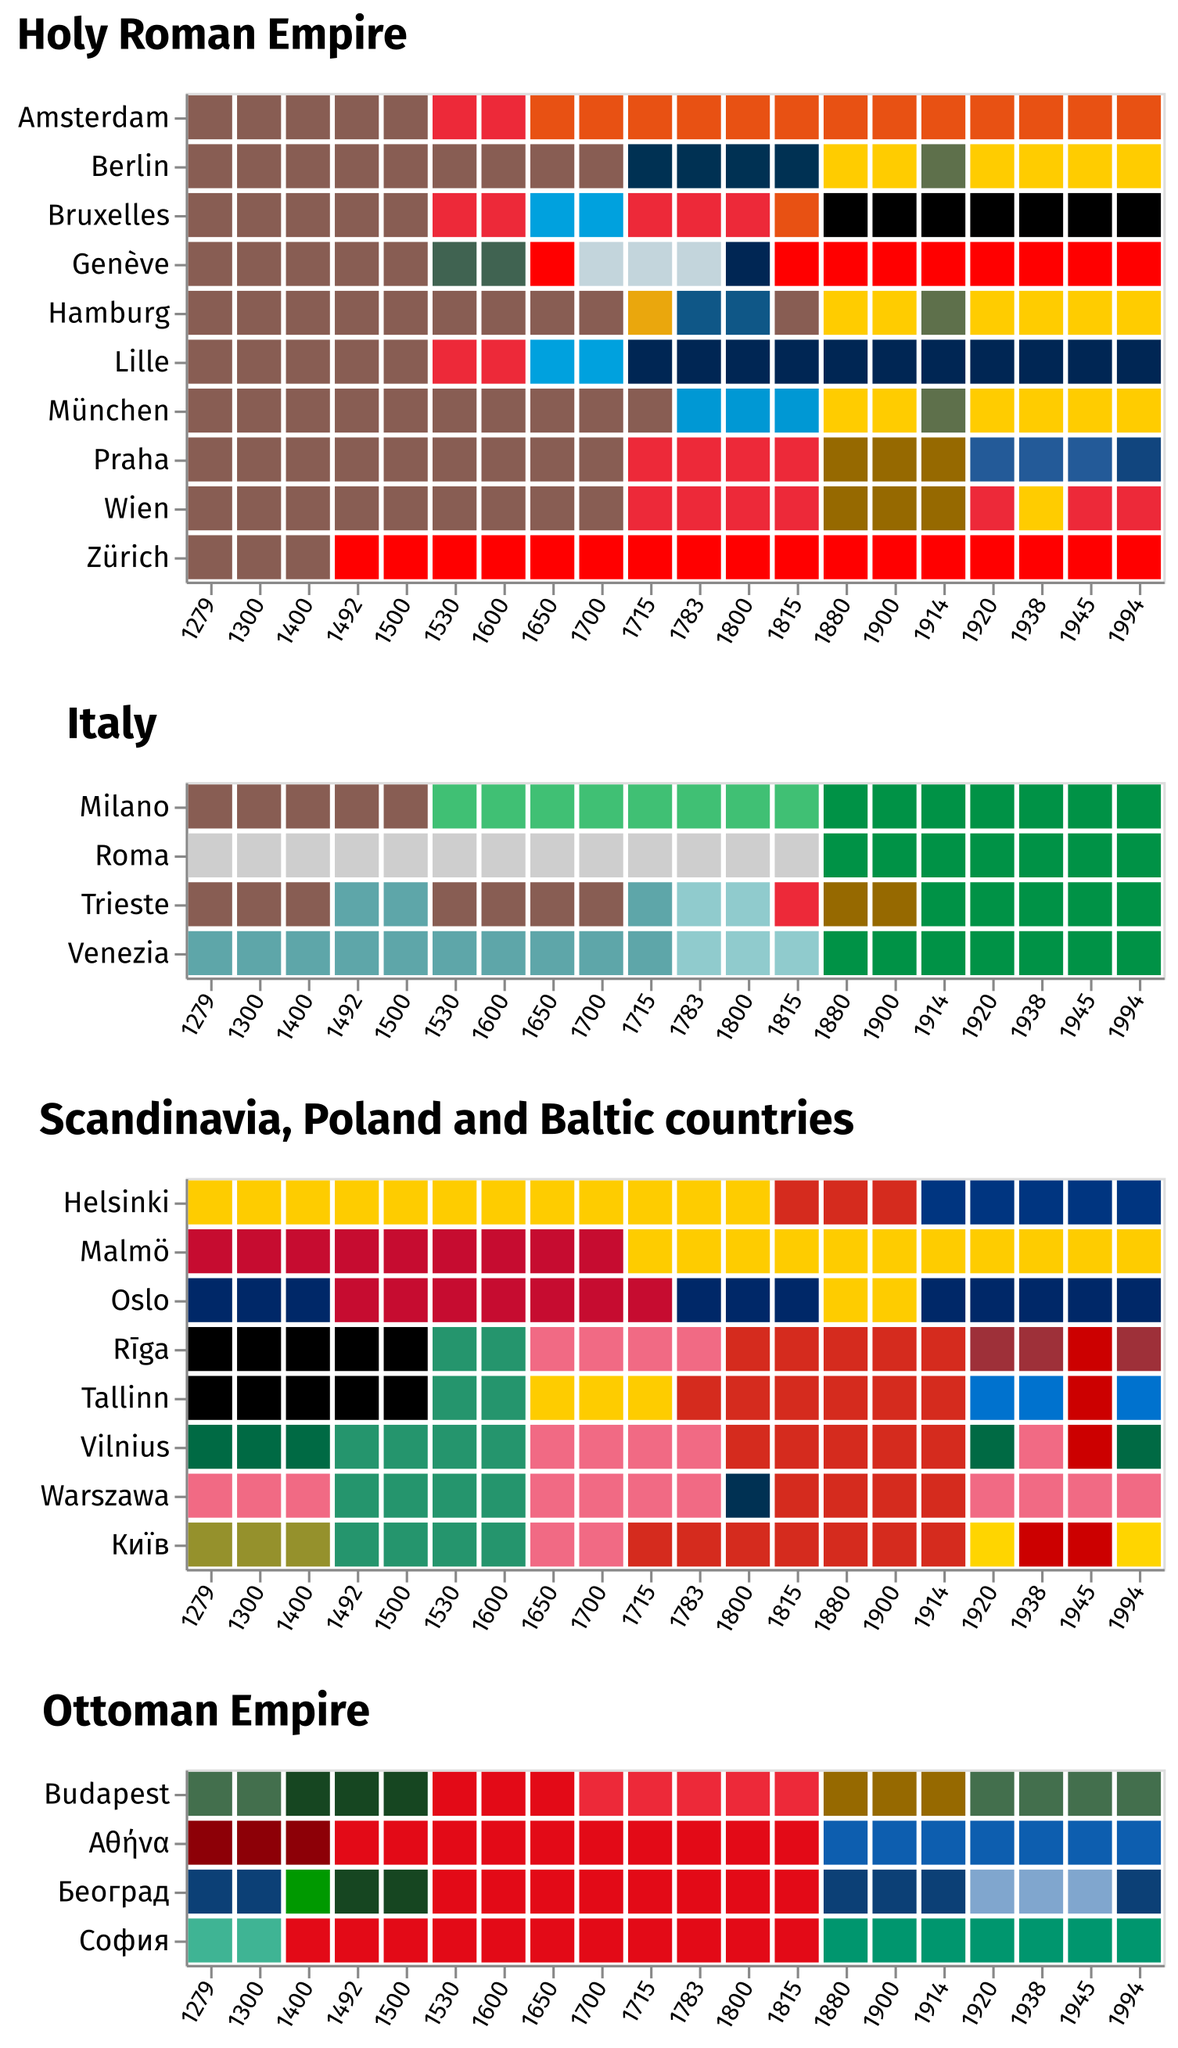
The map I feel the most proud of
Day 24 – Historical map and Day 25 – Interactive map could be single contribution. It is still far from perfect:
- the color palette is hard to adjust (from both temporal and spatial perspectives);
- only the interactive view can fit the legend;
- a calendar view with intervals would have looked better;
- underlying data needs more polishing;
but I’m really happy I came to this basic rendering with little programming.
The most time-consuming map
Day 5 – OpenStreetMap was not really hard to implement per se, but there was a lot of downloading from OpenStreetMap, faulty requests, quotas to deal with. While the code is simple, it took more than a day to finetune.
The most fun experience
I tried to find my away around Observable for this Day 14 – Map with a new tool challenge and @fil came to help. I learned a lot here!
The underrated map
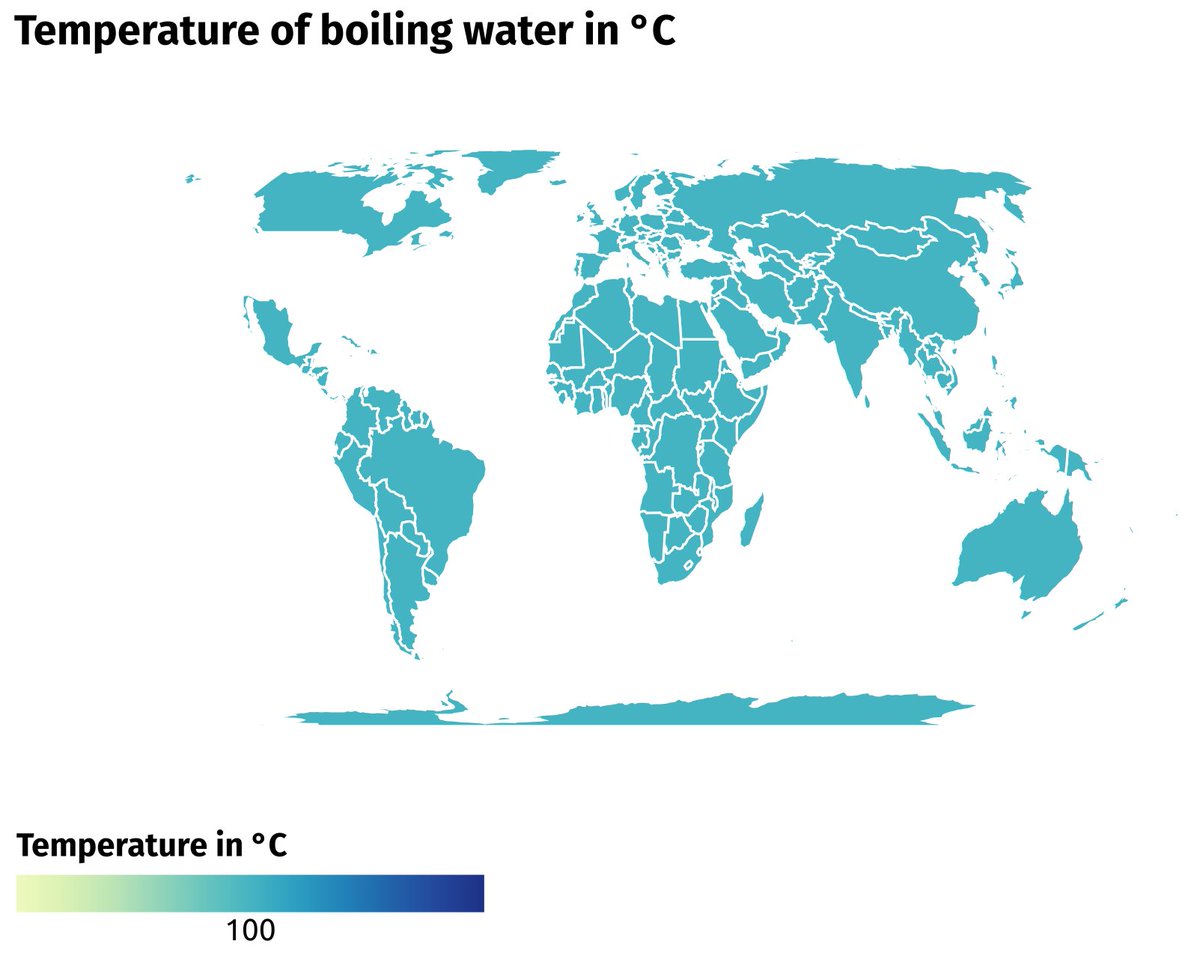
I still think my Day 18 – Water is rather cool, but Twitter stats seem to prove the opposite.
Moral of the story: have fun making your maps!
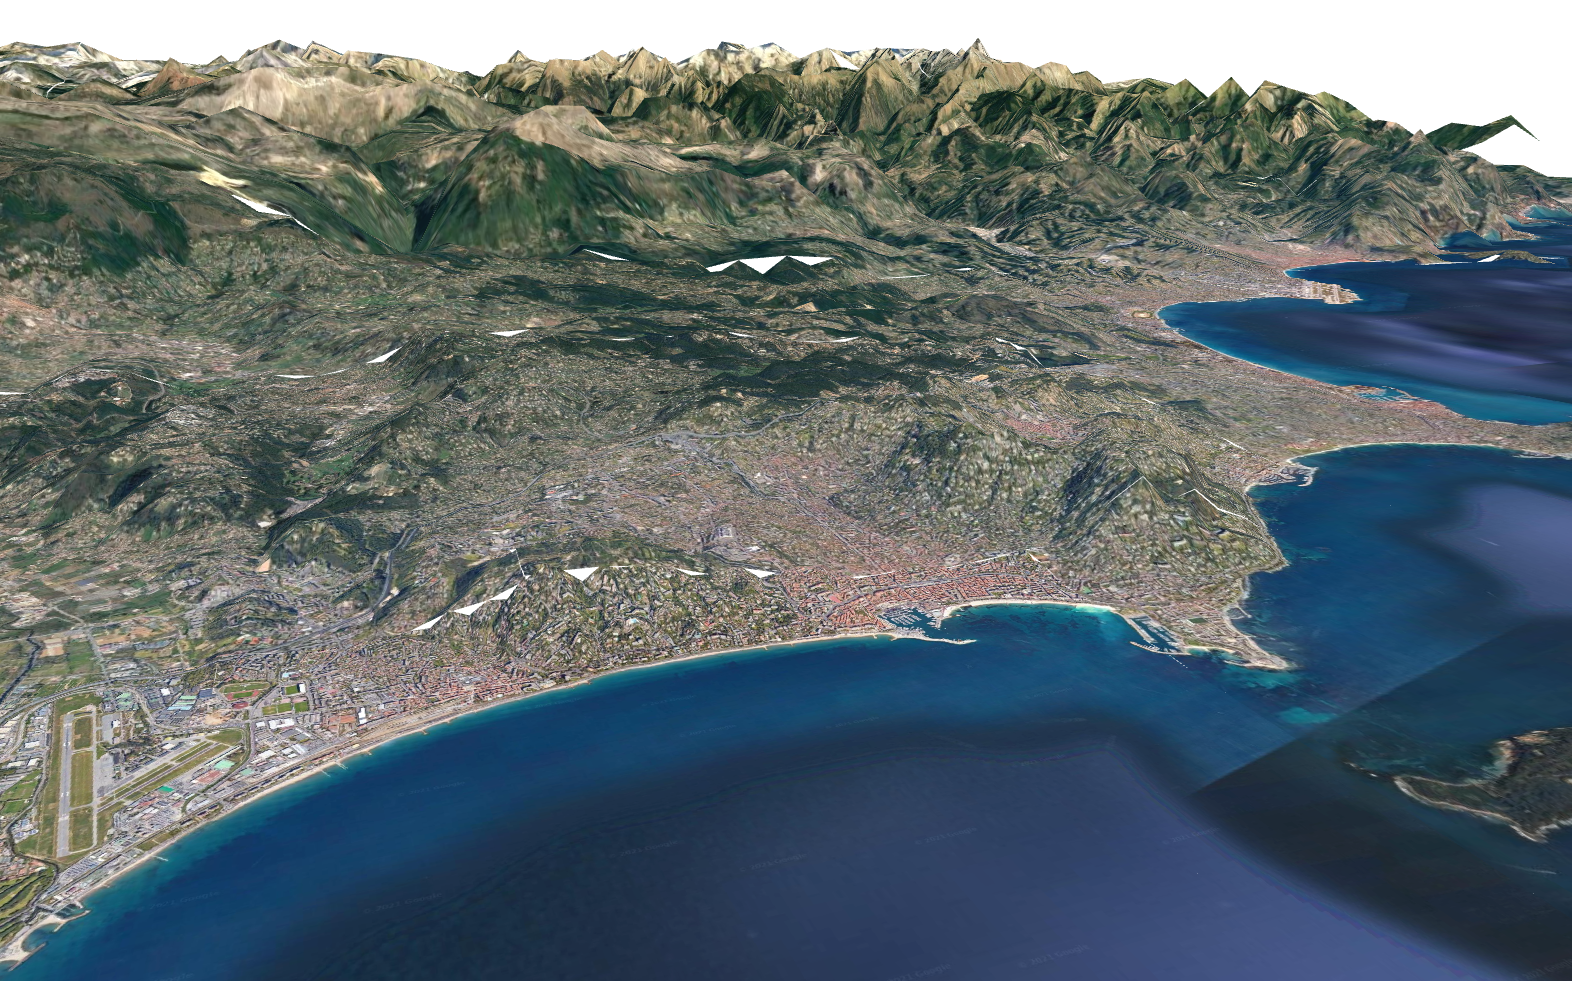
The source of frustration
Day 11 – 3D was not a topic I felt comfortable with, yet I wanted to complete this rendering (without glitches) with Python. I am still new to the world of GeoTIFF files and my expectations did not meet my skills here. After too many hours spent on this project, I just took a screenshot of my best rendering with QGIS. QGIS was a new tool for me by the way.
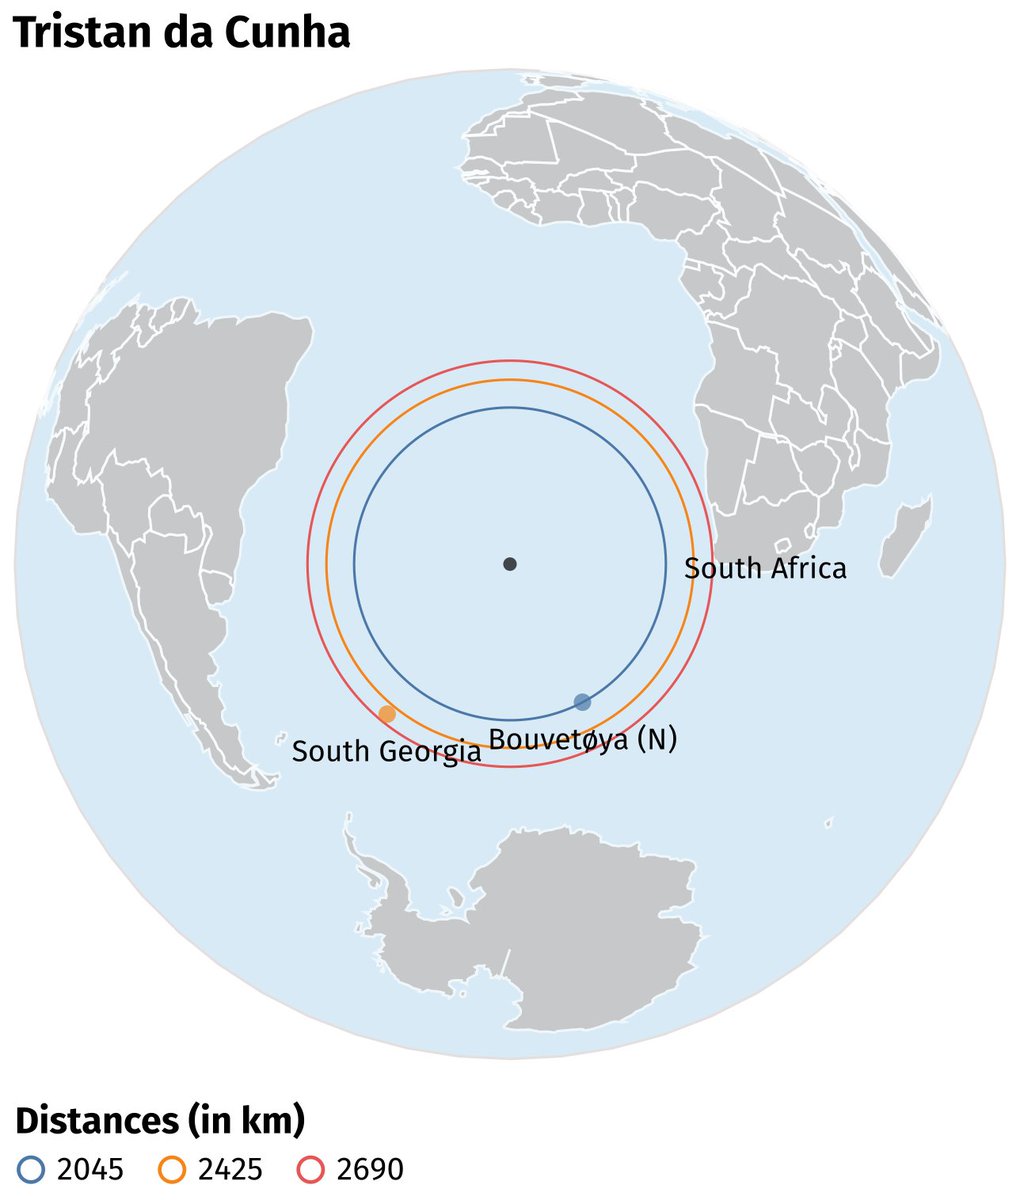
The cheapest joke
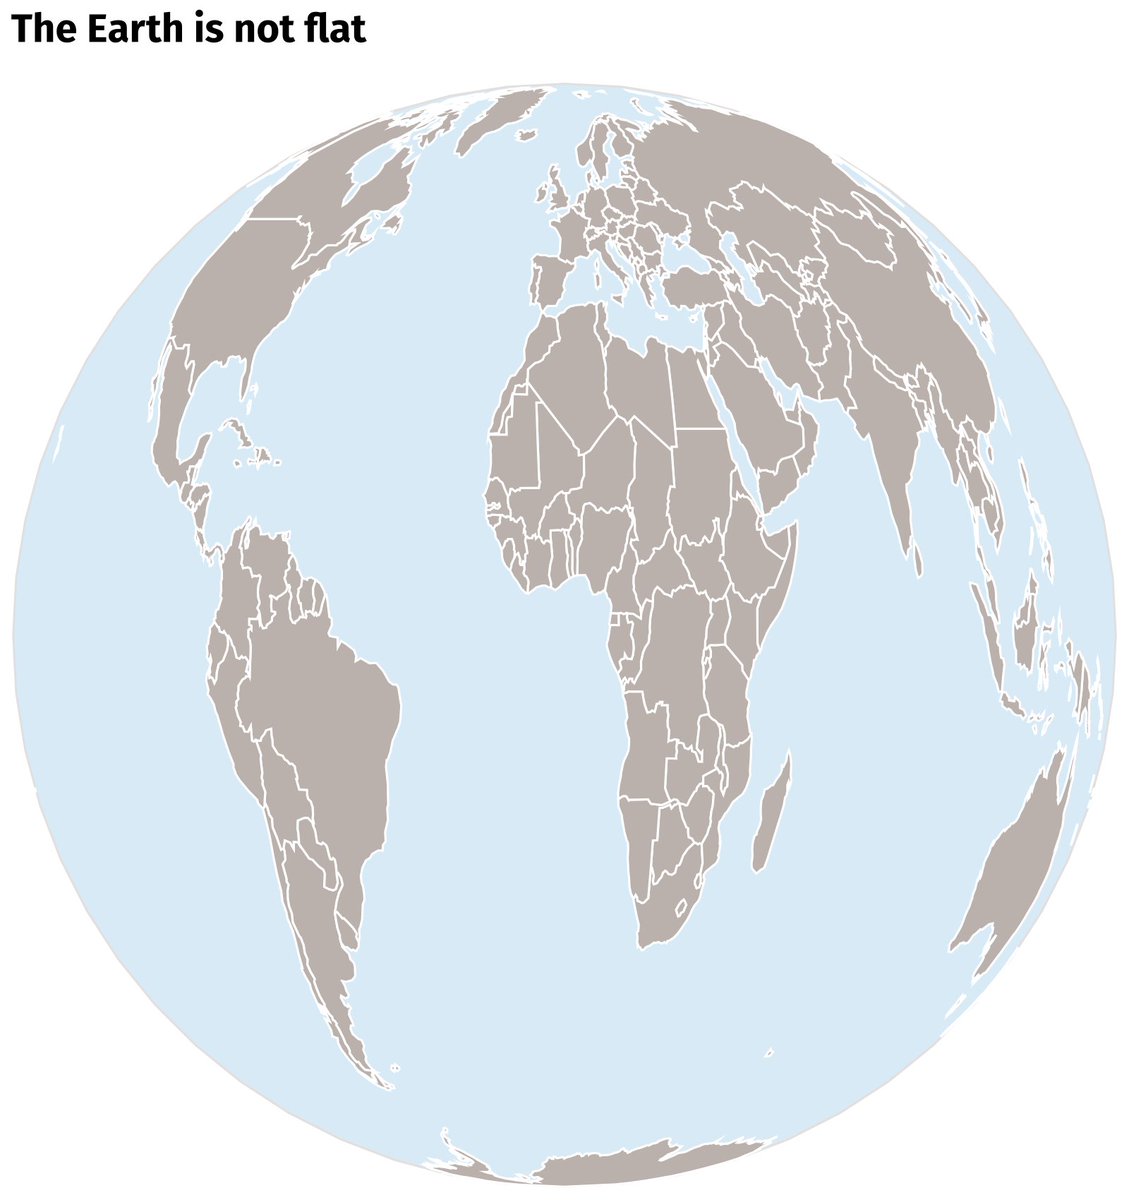
There are many candidates, and it is hard to do a tie-break between the two latest ones: Day 28 – The Earth is not flat and Day 29 – NULL.