Advanced and scientific Python

Materials to brush up your Python skills
Matplotlib
This session is based on a Python files. When you open this file with Visual Studio Code, you will notice pseudo-cells prefixed as follows:
Clicking on Run Cell (or pressing Maj+Enter) runs an IPython kernel appearing (usually) on the right side of your screen.
This approach is comfortable to preliminary projects:
- you can run, debug the code as a usual Python file, making your work reproducible;
- you can explore ideas with a notebook style, making your work interactive.
The file is located in the python/ folder:
matplotlib_demo.py
More exercices for Matplotlib
-
Trace the graph of function $t \mapsto e^{-t} \cdot \cos(2\,\pi\,t)$ for $t\in[0,5]$
-
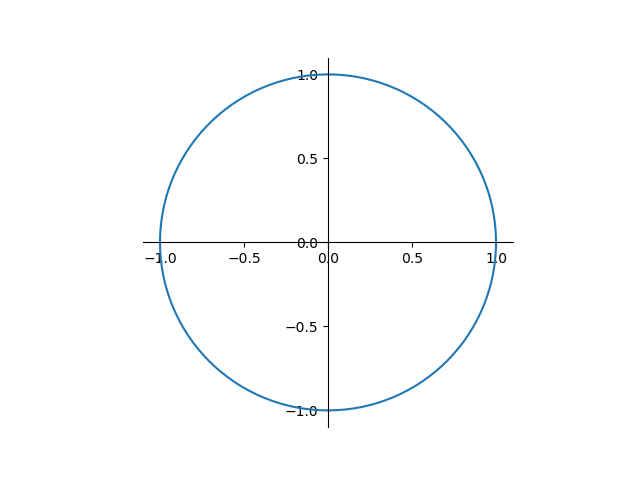
Consider the polar coordinate curve defined by $r = \sin(5\,\theta)$, compute the x- and y- coordinates using Numpy functions, then plot the curve.
-
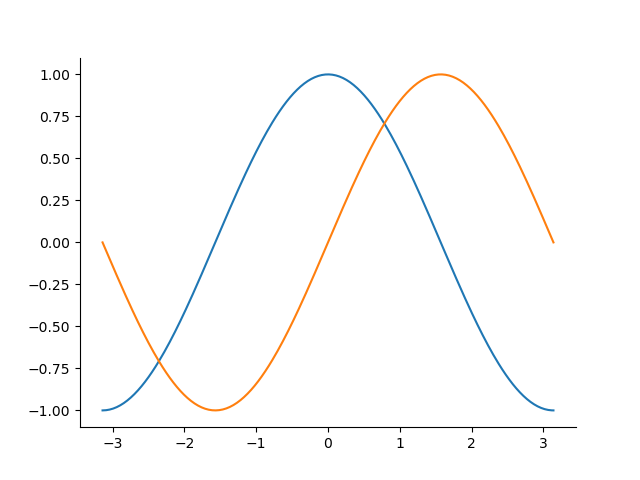
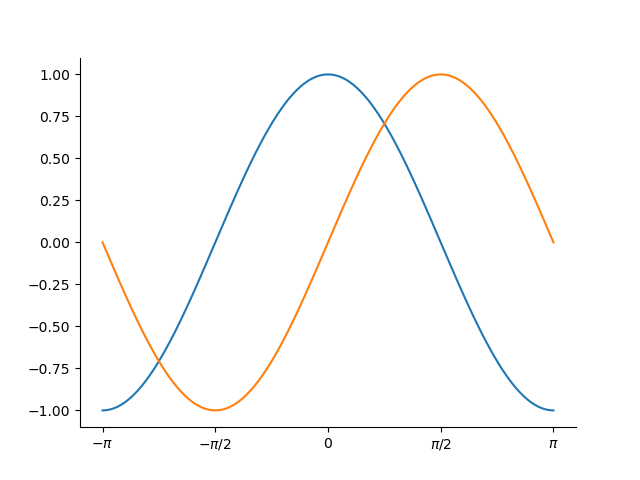
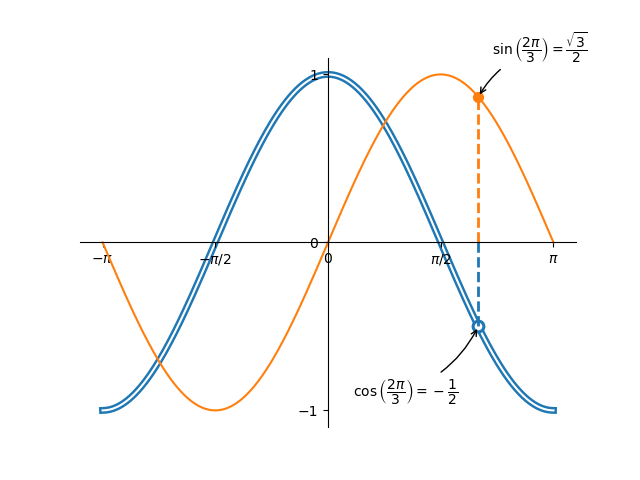
Start from the following code, and edit it through the followings steps to reach the final design:
import matplotlib.pyplot as plt import numpy as np x = np.linspace(-np.pi, np.pi, 256, endpoint=True) c, s = np.cos(x), np.sin(x) fig, ax = plt.subplots() (cos_plot,) = ax.plot(x, c) (sin_plot,) = ax.plot(x, s)-
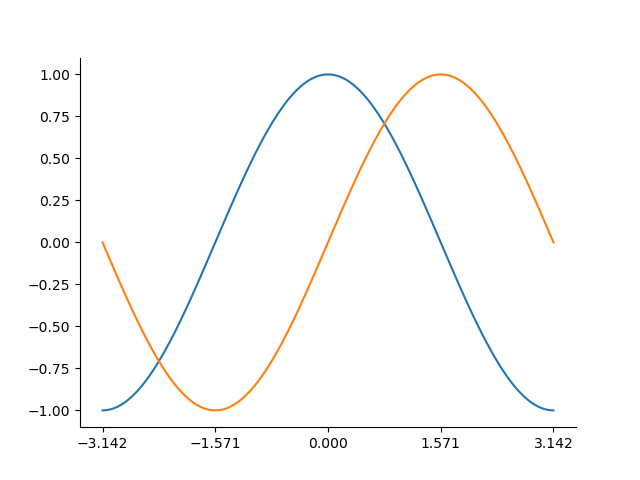
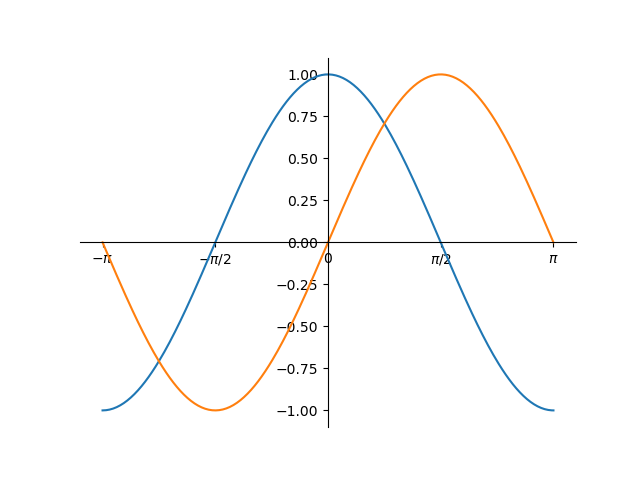
Remove the top and right spines
-
Set x-tick values for multiples of $\pi$
-
Set x labels with the $\pi$ symbol
-
Move the spines so that they cross at 0, 0
-
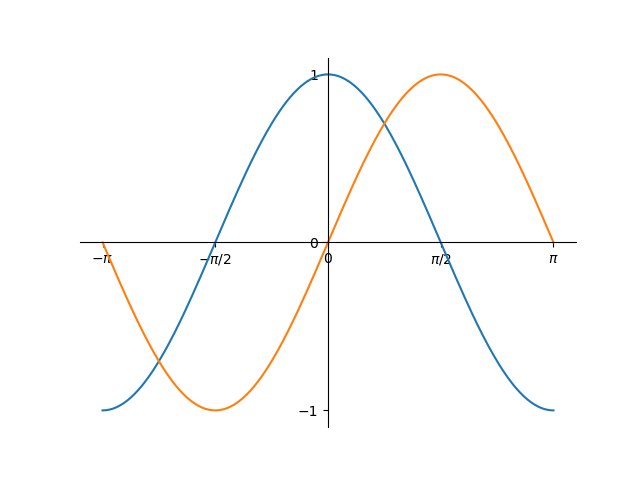
Adjust further the y-axis
-
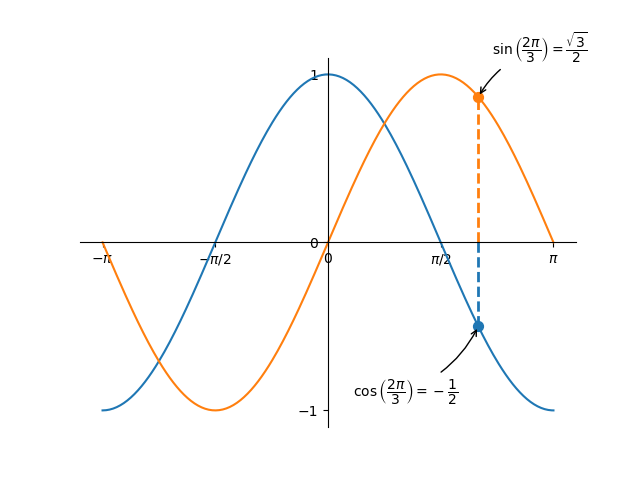
Annotate some points
-
Try to imagine some trick to get the following rendering
-
-
Take lessons from Exercice 3 to produce the following plot: